Bandi Tulasi
Workflow Cursor makes it easy in adding, scheduling, and modifying a task, time log tracking, based on events automates the completion of the task that ensures perfect task management.
Location: 60 Albert Street #14-04 OG Albert Complex, 189969
OG Albert
Smart tech solutions for businesses across Singapore
Smart tech solutions for businesses across Singapore
SmartCursors Pte Ltd is a Singapore-based technology services provider known for delivering innovative digital solutions tailored to SMEs. From software development to IT consultancy, the team brings practical expertise to help businesses streamline operations and embrace digital transformation. Their client-first approach and commitment to quality have made them a trusted name in the local tech scene. Beyond core IT services, SmartCursors offers web development, mobile app solutions, and system integration support suited to startups and established enterprises alike. Flexible engagement models and transparent project management ensure clients stay informed and in control throughout every engagement. Whether you need a bespoke application or strategic IT advice, SmartCursors is well equipped to deliver. Drop by their Bugis office or reach out online to discover how SmartCursors can help your business thrive in the digital age. Their friendly consultants are always ready to chat about your next project.Based on 13 Google reviews
No negative reviews yet.
Bandi Tulasi
Workflow Cursor makes it easy in adding, scheduling, and modifying a task, time log tracking, based on events automates the completion of the task that ensures perfect task management.
Manoj Kumar
Workflow Cursor provides a mixture of visibility, showing insights into progress; managing projects, cases, tasks, time tracking, and sending invoices
Ava Chong
Workflow Cursor makes convenient resource allocation an integral part that makes aware of the whole project cost and other related things which increases performance and productivity.
Danny Lim
Great product. I am using CRM and Workflow Cursors for my company. SmartCursors Analytics is the best, easy to understand the business ups and downs through these dashboards.
Meena Reddy
Workflow cursor helps us to reduce redundancy leading to higher efficiency and enabling better allocation of resources, hence increased productivity and low costs for your business.
SmartCursors Pte Ltd
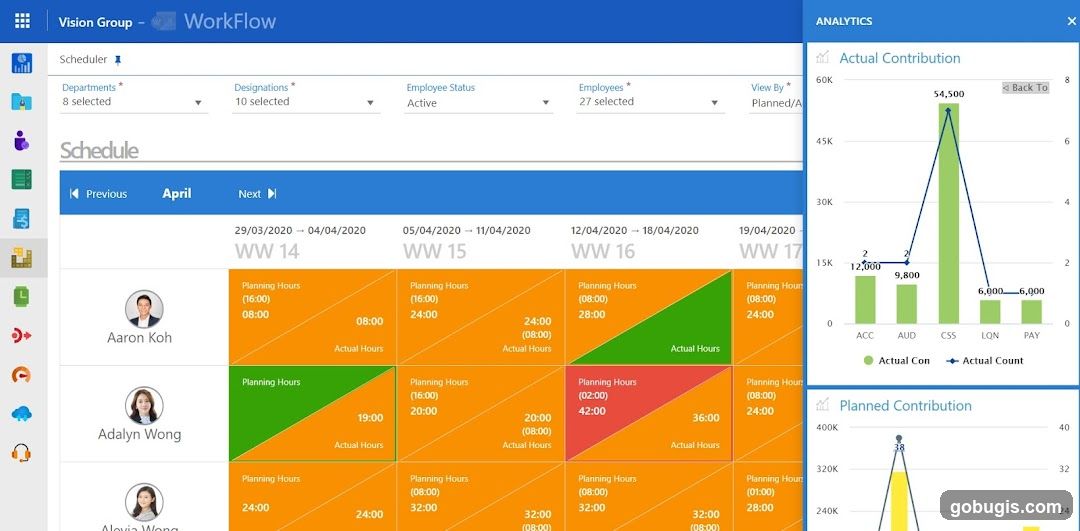
WorkFlow Scheduler and Analytics
A screenshot of a software interface displaying a workflow scheduler and analytics dashboard. The scheduler shows employee schedules for April, with columns for different weeks and rows for employees like Aaron Koh and Adalyn Wong. It details planning hours and actual hours. The analytics section includes charts for 'Actual Contribution' and 'Planned Contribution', showing data points like ACC, AUD, CSS, LON, and PAY.
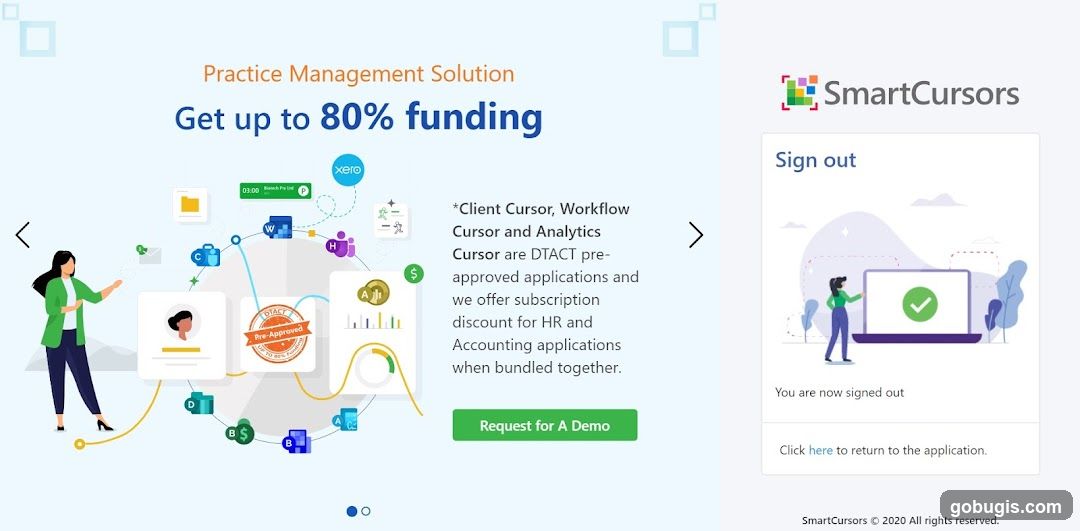
SmartCursors Practice Management Solution
The image displays a promotional graphic for SmartCursors, a practice management solution. The graphic highlights "Get up to 80% funding" and mentions "Client Cursor, Workflow Cursor and Analytics Cursor" as DTACT pre-approved applications. It also states that subscription discounts are offered for HR and Accounting applications when bundled. A "Request for A Demo" button is visible. On the right side, a "Sign out" confirmation message is displayed with an illustration of a person interacting with a laptop showing a checkmark.
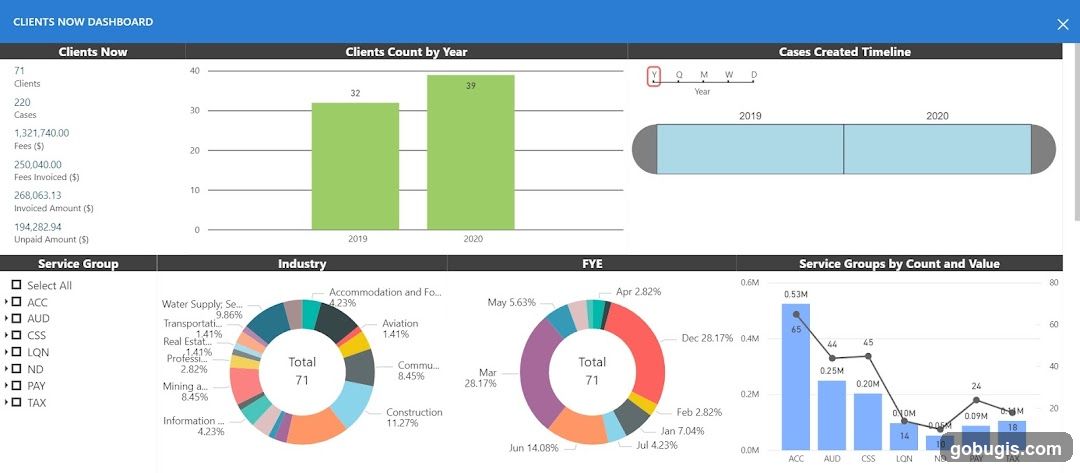
Clients Now Dashboard
A dashboard displaying client statistics, including client and case counts, fees, invoiced and unpaid amounts. It features charts showing client count by year, cases created timeline, industry breakdown, fiscal year end breakdown, and service groups by count and value.
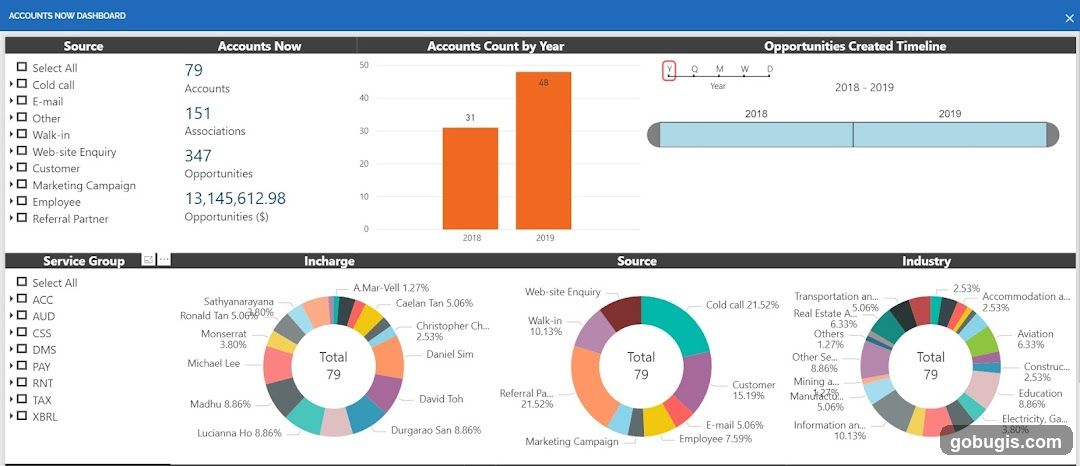
Accounts Now Dashboard
A dashboard displaying various metrics related to accounts, including accounts count by year, opportunities created timeline, and breakdowns by service group, incharge, source, and industry. The dashboard shows 79 accounts, 151 associations, and 347 opportunities with a total value of $13,145,612.98. It also includes bar charts and donut charts to visualize data.
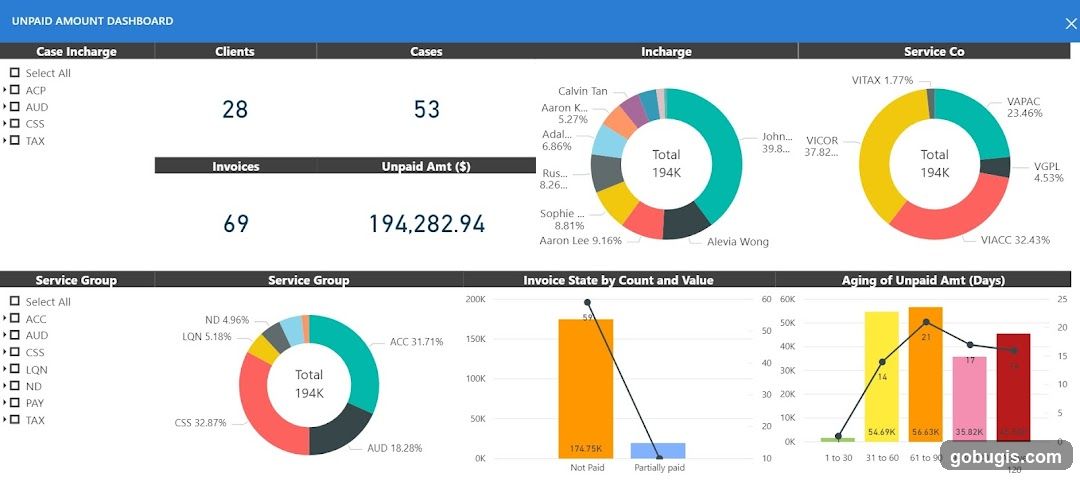
Unpaid Amount Dashboard
A dashboard displaying unpaid amounts with various charts and data points. It includes breakdowns by case incharge, clients, cases, service company, and service group. There are also charts showing invoice state by count and value, and the aging of unpaid amounts in days.
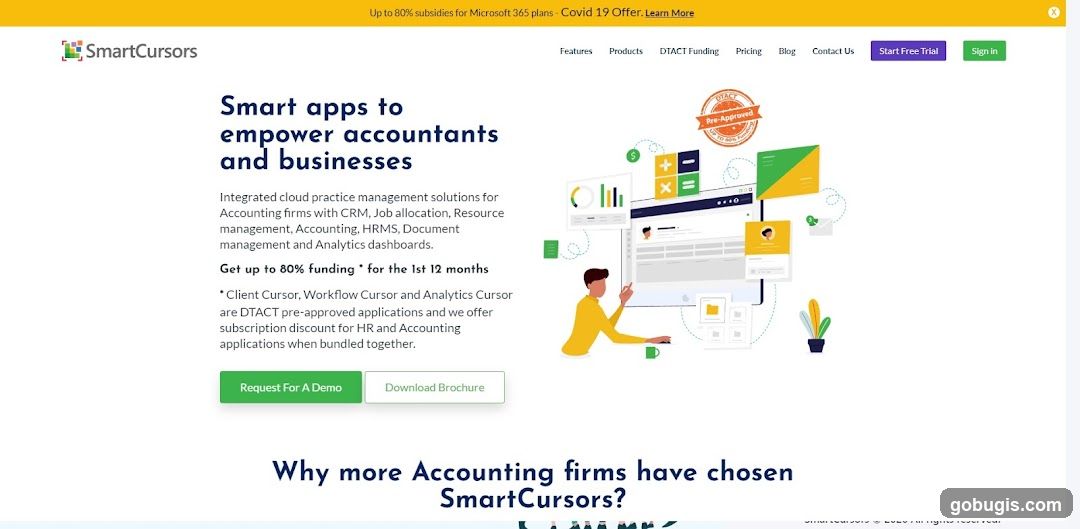
Smart apps to empower accountants and businesses
The image displays a website landing page for SmartCursors, a company offering integrated cloud practice management solutions for accounting firms. The page highlights features like CRM, Job allocation, Resource management, HRMS, Document management, and Analytics dashboards. It also promotes a "Get up to 80% funding for the 1st 12 months" offer and mentions DTACT pre-approved applications with subscription discounts. The page includes buttons for "Request For A Demo" and "Download Brochure," as well as navigation links for Features, Products, DTACT Funding, Pricing, Blog, and Contact Us. A "Start Free Trial" and "Sign in" button are also visible.
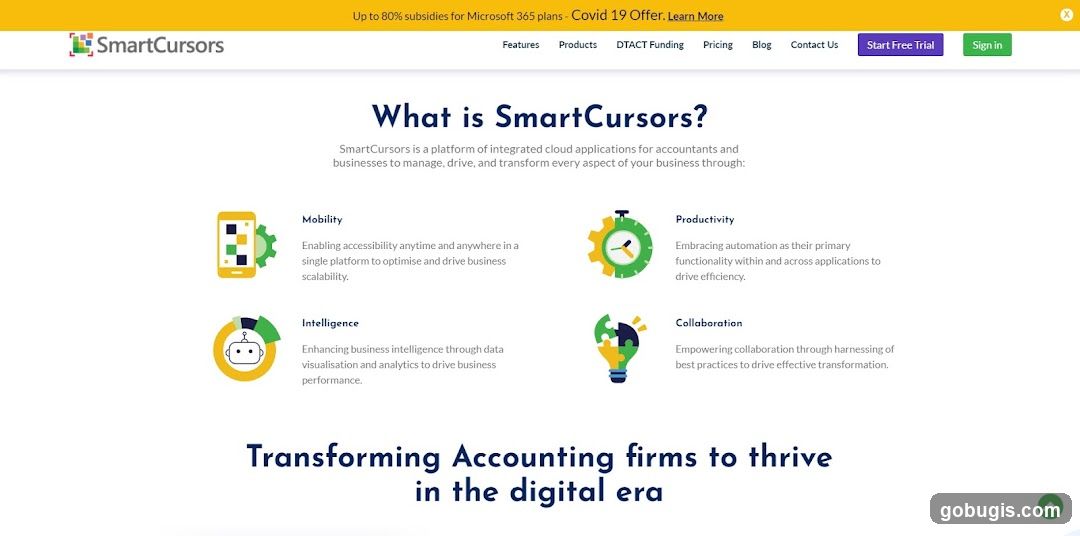
SmartCursors Platform Overview
The webpage introduces SmartCursors as a platform of integrated cloud applications designed for accountants and businesses. It highlights four key aspects: Mobility, Productivity, Intelligence, and Collaboration, explaining how each contributes to business management, driving growth, and transformation. The page also features a banner about subsidies for Microsoft 365 plans and offers options to start a free trial or sign in.
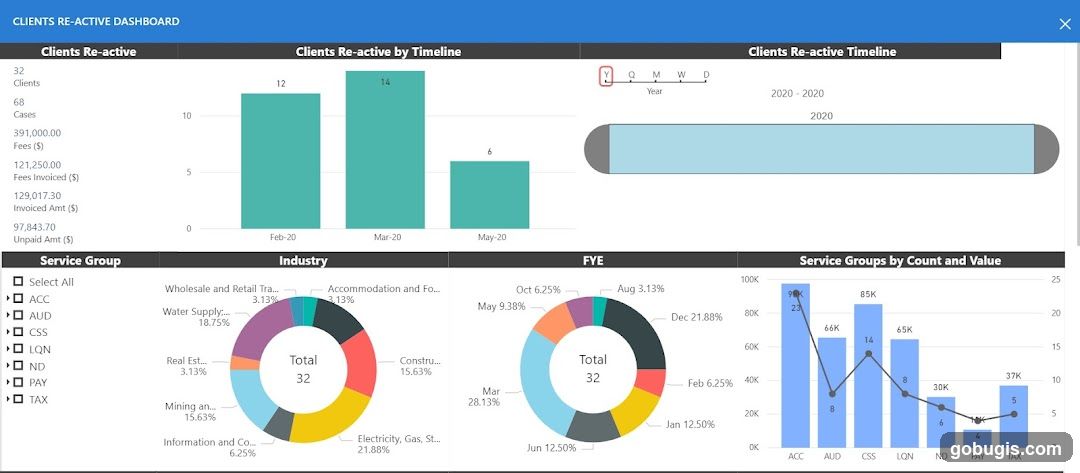
Clients Re-active Dashboard
A dashboard displaying client re-activation data. It includes key metrics like clients, cases, fees, and invoiced amounts. Visualizations show client re-activation by timeline (bar chart), industry breakdown (pie chart), fiscal year end breakdown (pie chart), and service groups by count and value (bar and line chart).
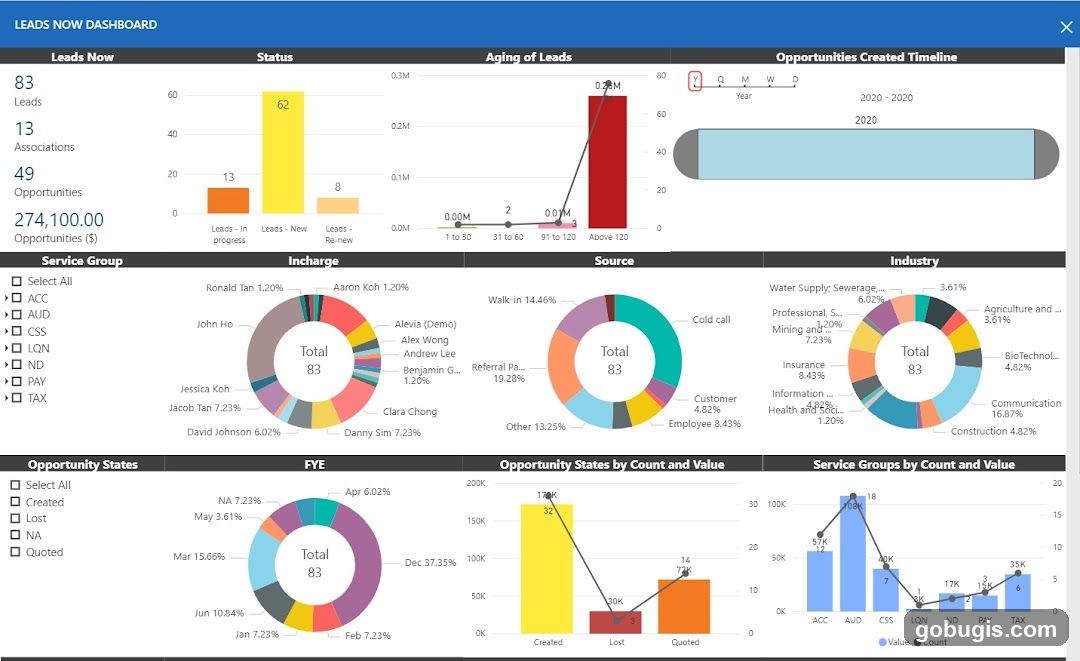
Leads Now Dashboard
A dashboard displaying various metrics related to leads and opportunities. It includes charts and graphs for 'Leads Now', 'Status', 'Aging of Leads', 'Opportunities Created Timeline', 'Service Group', 'Incharge', 'Source', 'Industry', 'Opportunity States', 'FYE', 'Opportunity States by Count and Value', and 'Service Groups by Count and Value'. Key metrics shown are 83 leads, 13 associations, 49 opportunities, and $274,100.00 in opportunities. The charts visualize lead status, aging, creation timeline, and breakdowns by service group, incharge, source, and industry.
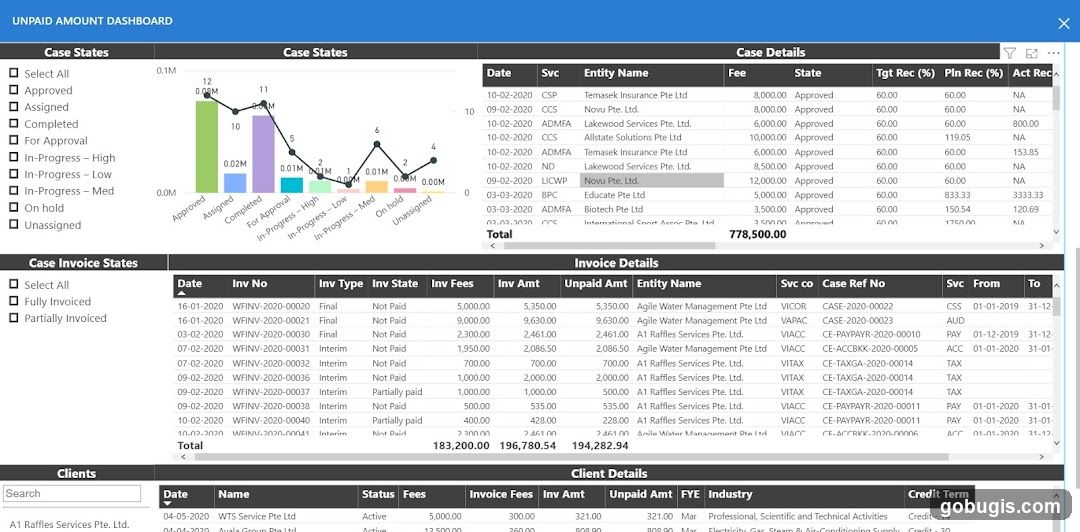
Unpaid Amount Dashboard
A dashboard displaying financial data related to unpaid amounts. It includes charts and tables showing case states, case details, invoice details, and client details. The case states chart visualizes the number of cases in different stages like Approved, Assigned, Completed, For Approval, In-Progress, On hold, and Unassigned. The case details table lists entities, fees, states, and recovery percentages. The invoice details table provides information on invoice numbers, types, states, fees, amounts, and unpaid amounts. The client details section shows client names, status, fees, and industry.
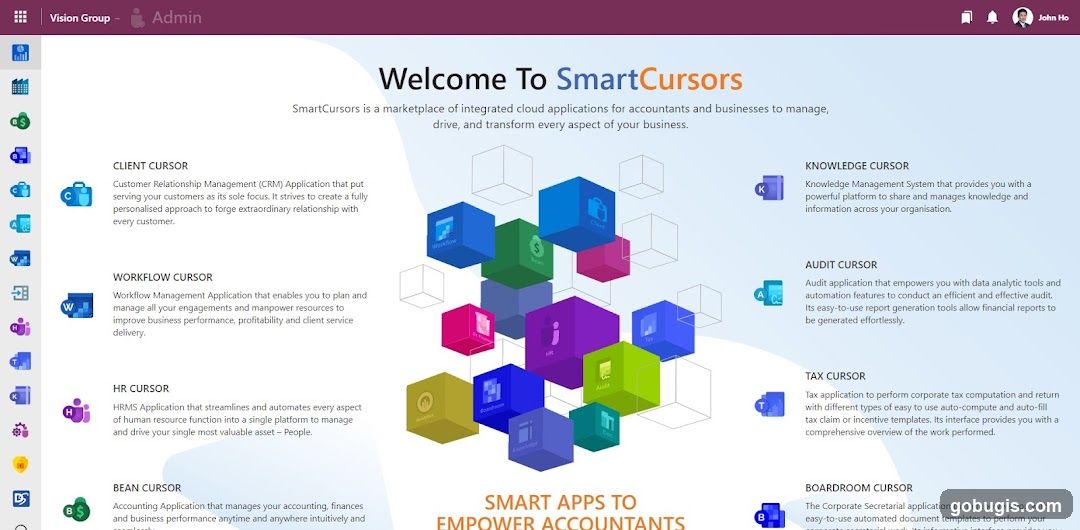
Welcome To SmartCursors
A digital interface showcasing various cloud applications for businesses. The page is divided into sections, each describing a different 'Cursor' application such as Client Cursor (CRM), Workflow Cursor, HR Cursor, Knowledge Cursor, Audit Cursor, Tax Cursor, and Boardroom Cursor. Each application is accompanied by a brief description and an icon. The central part of the page features a 3D graphic of colorful cubes, some of which display icons related to the applications. The top bar shows 'Vision Group - Admin' and the user 'John Ho'.
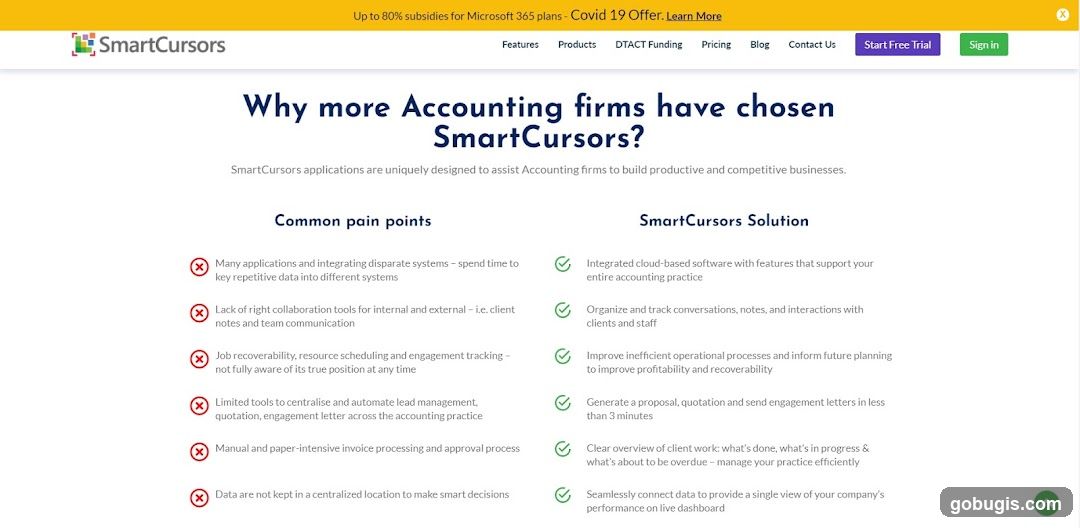
SmartCursors - Why More Accounting Firms Have Chosen SmartCursors
A webpage titled 'Why more Accounting firms have chosen SmartCursors?'. It outlines common pain points for accounting firms and presents the SmartCursors Solution. The page features the SmartCursors logo and navigation links for Features, Products, DTACT Funding, Pricing, Blog, and Contact Us. It also includes buttons for 'Start Free Trial' and 'Sign in'. The content contrasts issues like disparate systems and lack of collaboration tools with solutions like integrated cloud-based software and improved operational processes.
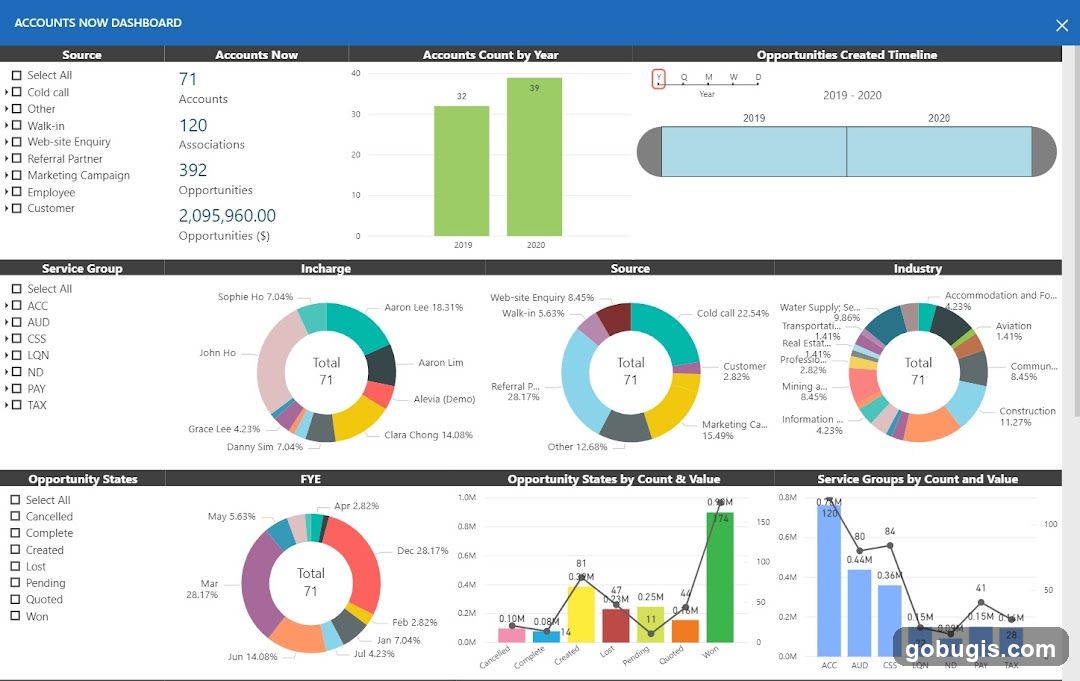
Accounts Now Dashboard
A dashboard displaying various sales and opportunity metrics. Key sections include 'Accounts Now' with counts for accounts, associations, and opportunities; 'Accounts Count by Year' showing a bar chart for 2019 and 2020; 'Opportunities Created Timeline' visualizing data from 2019-2020. Other charts break down data by 'Service Group', 'Incharge', 'Source', 'Industry', 'Opportunity States', and 'FYE'. Visualizations include pie charts, bar charts, and line graphs.
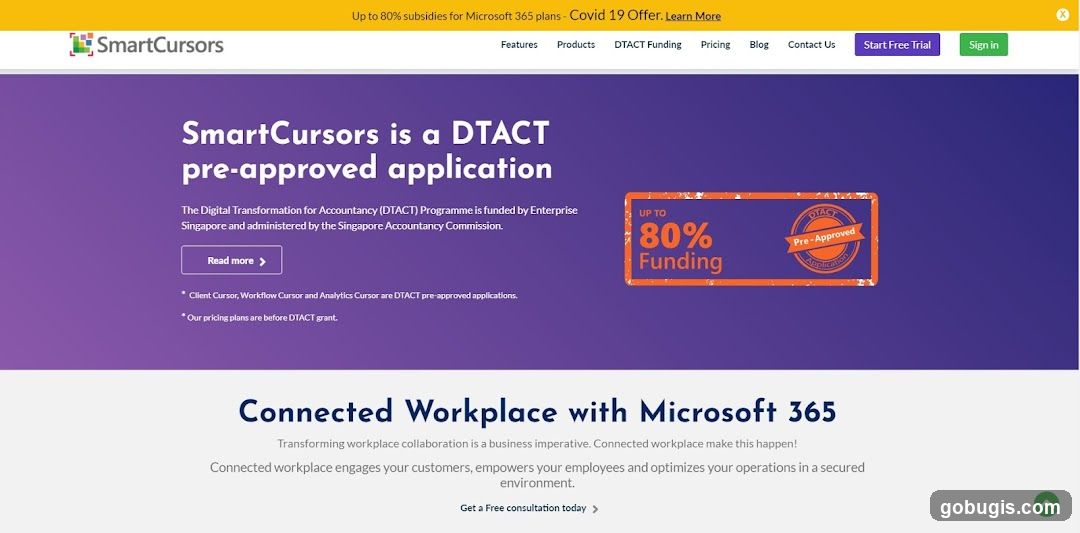
SmartCursors Website
A screenshot of the SmartCursors website, featuring a banner about Microsoft 365 subsidies and a Covid-19 offer. The main section highlights that SmartCursors is a DTACT pre-approved application, funded by Enterprise Singapore and administered by the Singapore Accountancy Commission. It includes a 'Read more' button and details about pricing plans. Below this, there is a section titled 'Connected Workplace with Microsoft 365' with a call to action for a free consultation.
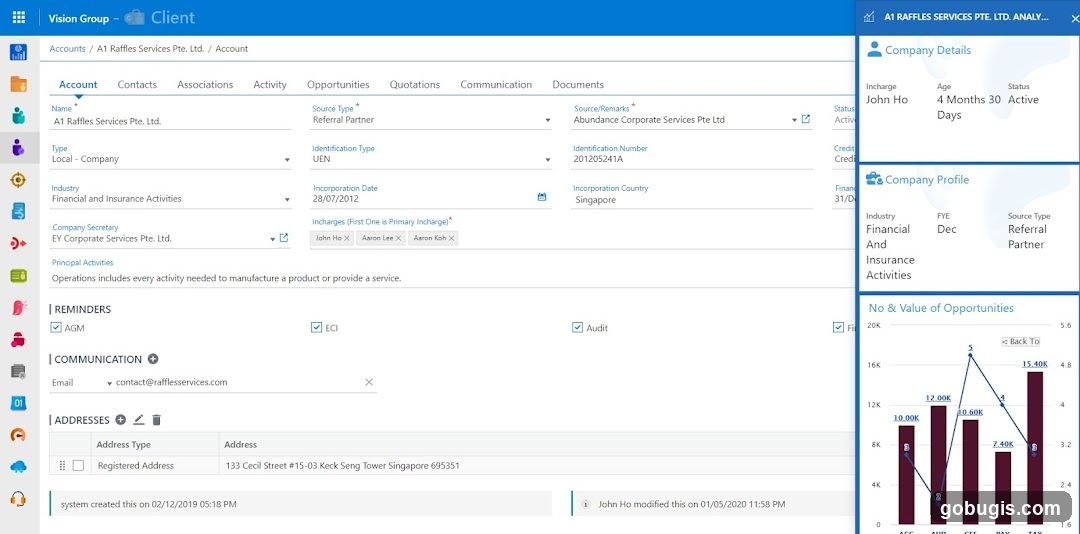
Client Account Details
This is a screenshot of a client account management system. It displays detailed information about a company named A1 Raffles Services Pte. Ltd. The interface includes sections for account details, company profile, reminders, communication, and addresses. A graph shows the number and value of opportunities over time.
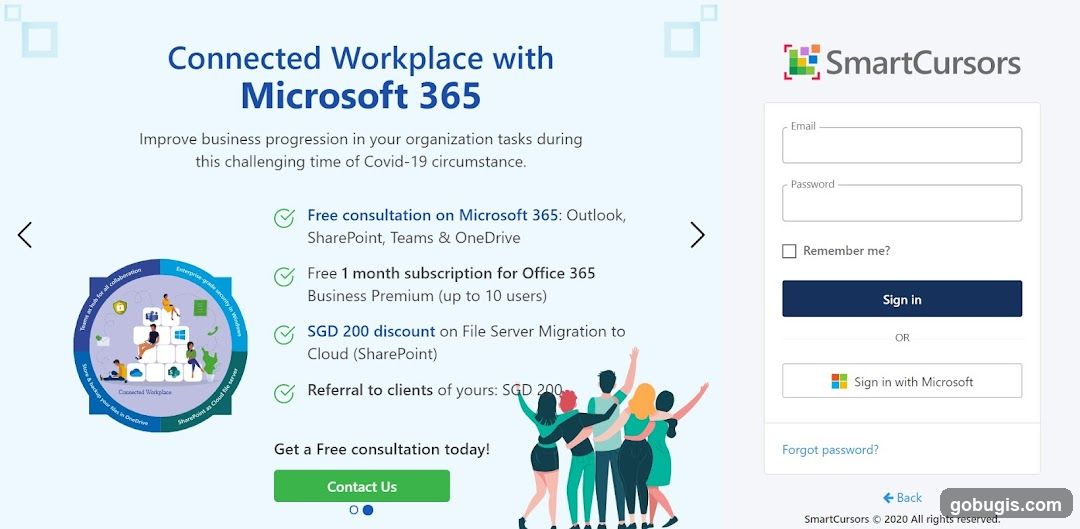
Connected Workplace with Microsoft 365
A webpage promoting Microsoft 365 services with a login form. It highlights benefits such as free consultations, a 1-month subscription for Office 365 Business Premium, a discount on File Server Migration to Cloud, and a referral offer. A 'Contact Us' button is also present.
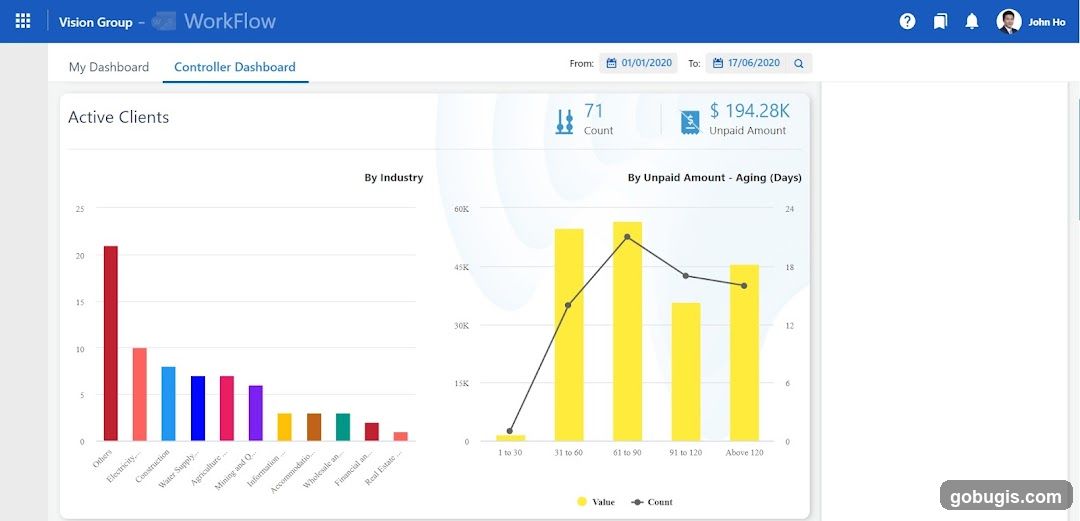
Controller Dashboard
This is a screenshot of a workflow dashboard. The dashboard displays active clients by industry and by unpaid amount aging in days. It shows a total count of 71 clients and an unpaid amount of $194.28K. The date range selected is from January 1, 2020, to June 17, 2020. The top bar shows the company name
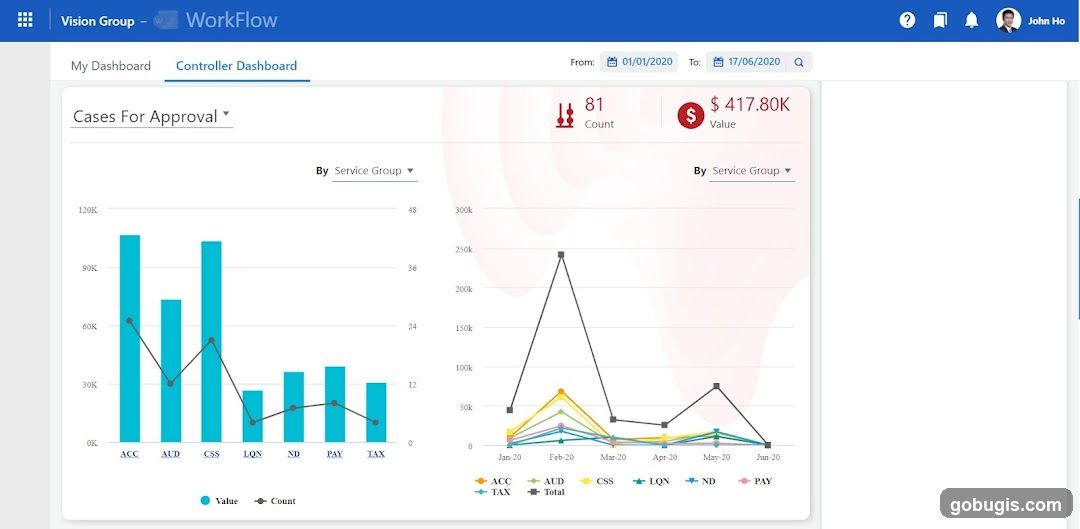
Controller Dashboard
A dashboard displaying workflow data. The left side shows a bar chart and line graph for 'Cases For Approval' by Service Group, with 'Value' and 'Count' metrics. The right side shows a line graph with multiple colored lines representing different categories (ACC, AUD, CSS, LQN, ND, PAY, TAX, Total) over a period from Jan-20 to Jun-20. Key figures displayed are 81 Count and $417.80K Value. The date range selected is from 01/01/2020 to 17/06/2020.
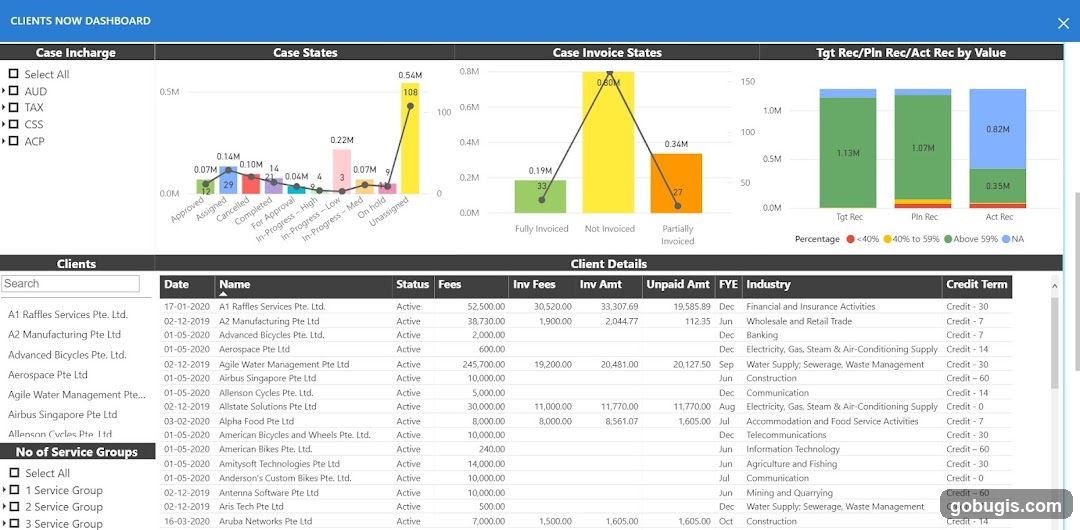
Clients Now Dashboard
A dashboard displaying client information, case statuses, and financial metrics. It includes charts for case incharge, case states, and invoice states, as well as a detailed client list with columns for date, name, status, fees, invoice details, industry, and credit terms.
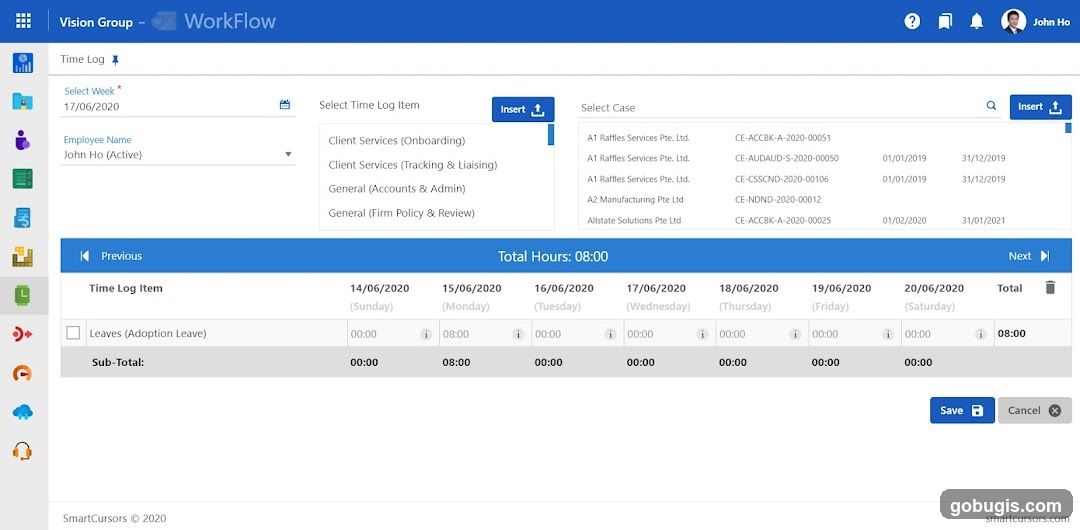
Time Log Workflow
A screenshot of a web-based workflow application for logging time. The interface shows fields for selecting a week and employee name, with options to select time log items and associated cases. A table displays time entries for different dates, with a total of 8 hours logged. The application is branded as 'Vision Group - WorkFlow' and 'SmartCursors'.
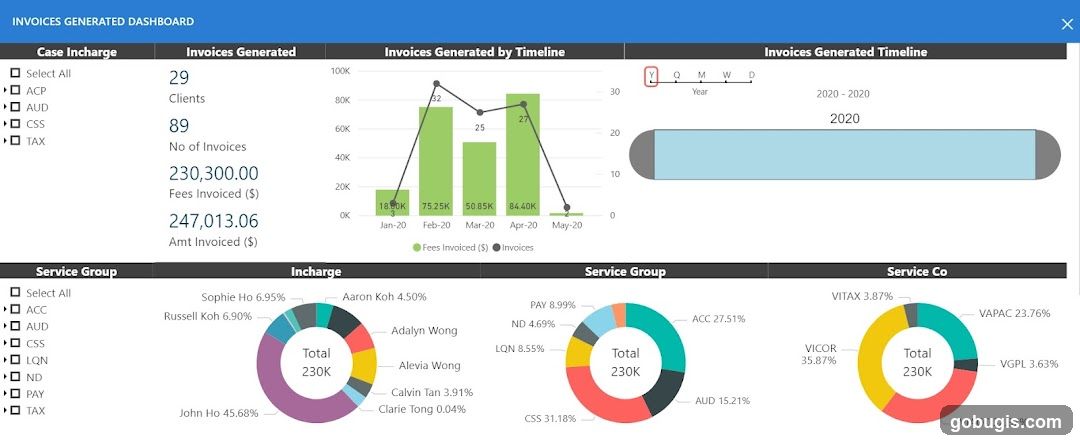
Invoices Generated Dashboard
A dashboard displaying various metrics and charts related to invoice generation. It includes sections for 'Case Incharge', 'Invoices Generated', 'Invoices Generated by Timeline', 'Service Group', and 'Service Co'. Key figures show 29 clients and 89 invoices, with fees invoiced at $230,300.00 and amount invoiced at $247,013.06. The timeline chart visualizes invoice generation from Jan-20 to May-20. Pie charts break down invoices by 'Incharge', 'Service Group', and 'Service Co', with John Ho accounting for 45.68% of invoices in the 'Incharge' category.
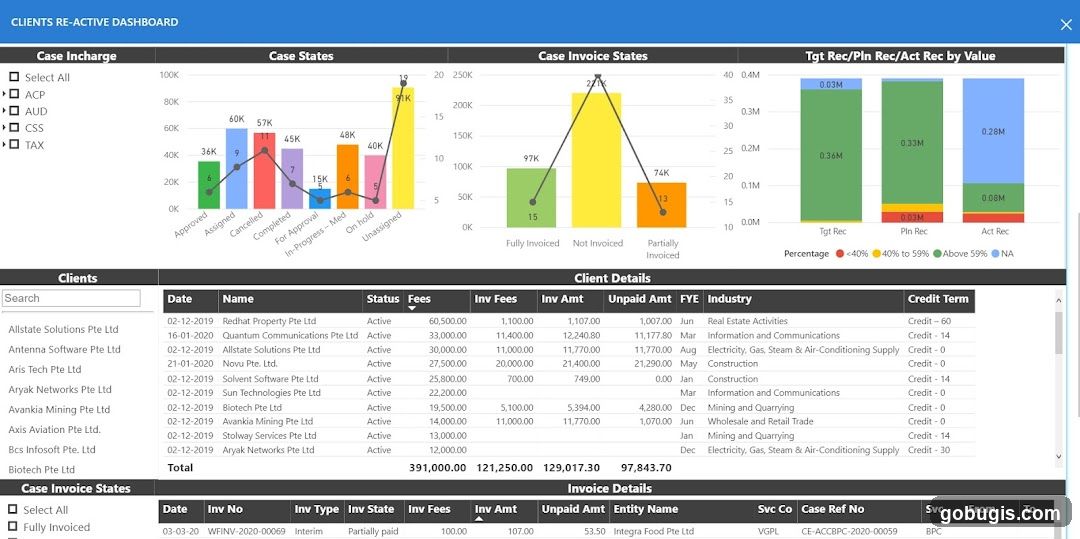
Clients Re-Active Dashboard
A dashboard displaying client data with several charts and tables. The charts show case incharge, case states, case invoice states, and target/plan/actual received value by value. The tables provide client details including date, name, status, fees, invoice details, FYE, industry, and credit term. There is also a section for invoice details.
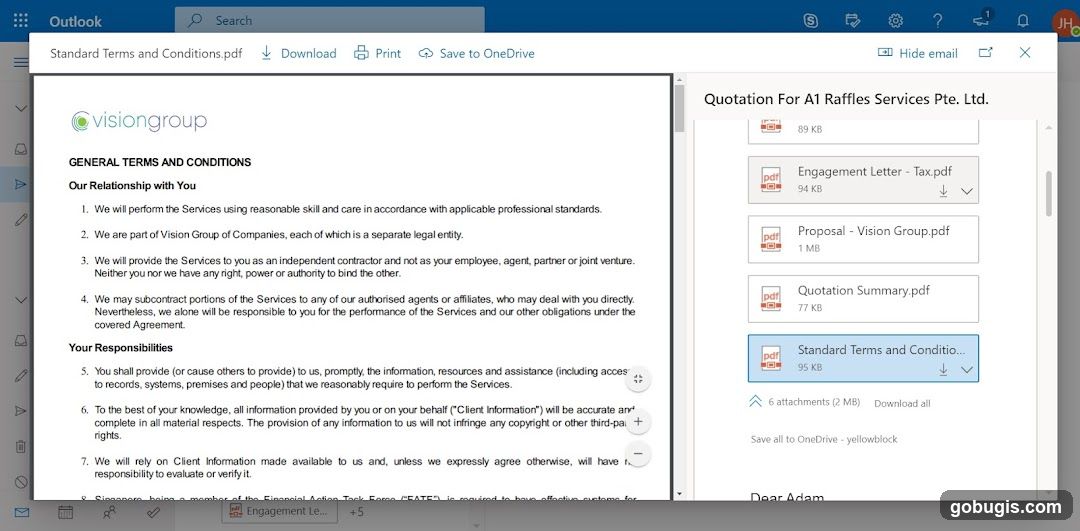
Standard Terms and Conditions Document
A screenshot of a computer screen displaying an email client with a document titled "Standard Terms and Conditions.pdf" open. The document contains text related to general terms and conditions, outlining the relationship and responsibilities between parties. On the right side of the screen, a list of attached files is visible, including "Engagement Letter - Tax.pdf", "Proposal - Vision Group.pdf", "Quotation Summary.pdf", and "Standard Terms and Conditions...".
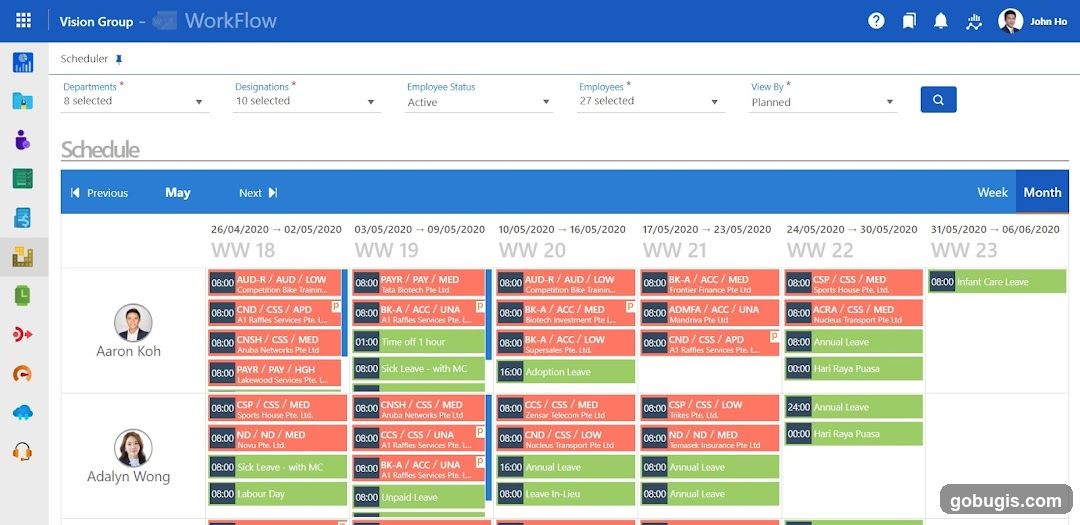
WorkFlow Scheduler
A screenshot of a WorkFlow scheduler interface displaying employee schedules for May 2020. The interface shows employee names, dates, and scheduled activities such as 'Competition Bike Training', 'Sick Leave', 'Annual Leave', and public holidays like 'Hari Raya Puasa'. Filters for departments, designations, employee status, and employee count are visible at the top.
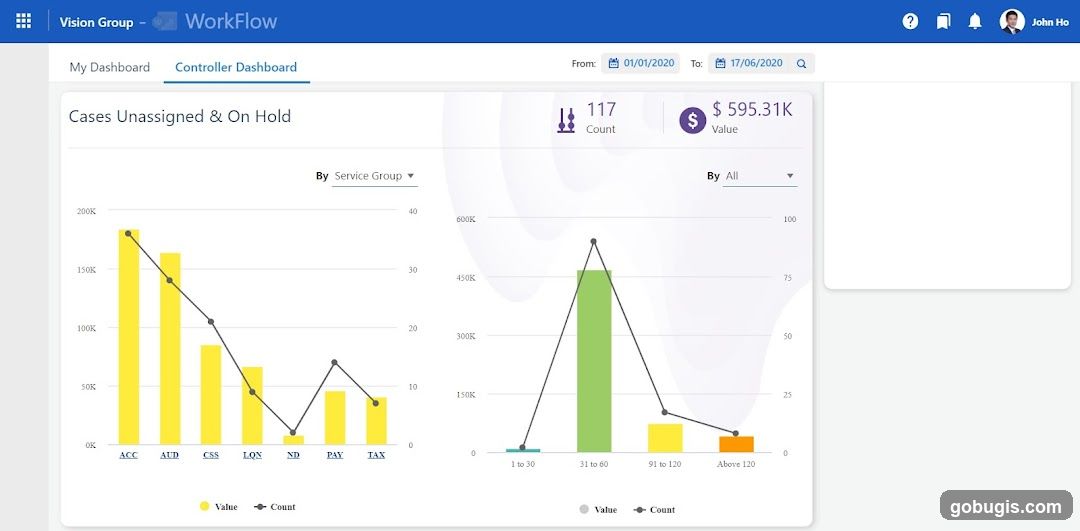
Controller Dashboard
A dashboard displaying 'Cases Unassigned & On Hold' with two charts. The left chart shows 'Value' and 'Count' by 'Service Group' with categories ACC, AUD, CSS, LON, ND, PAY, TAX. The right chart shows 'Value' and 'Count' by age ranges: 1 to 30, 31 to 60, 91 to 120, and Above 120. Key metrics displayed are 'Count' at 117 and 'Value' at $595.31K. The date range selected is from 01/01/2020 to 17/06/2020.
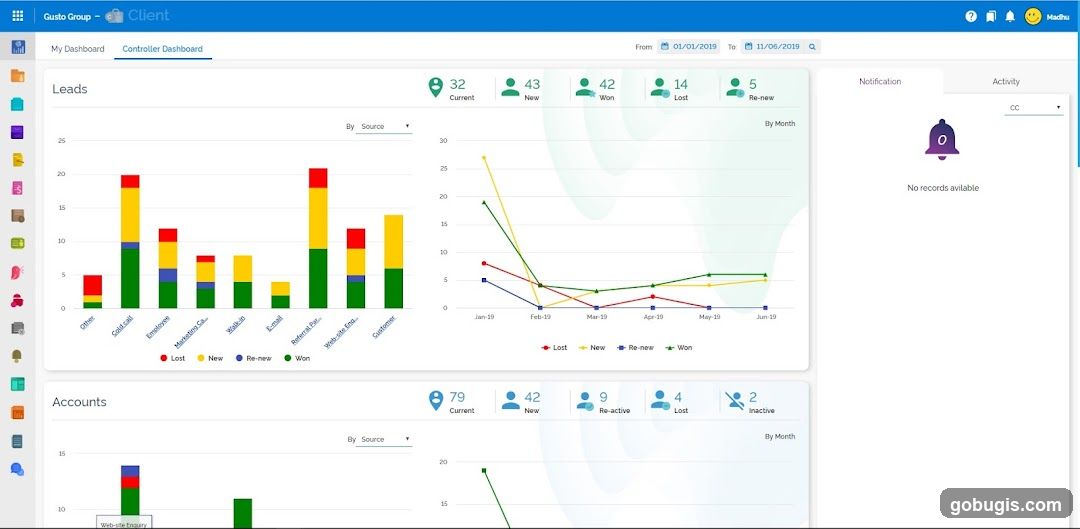
Controller Dashboard
This is a screenshot of a controller dashboard displaying lead and account data. The dashboard includes bar charts and line graphs showing lead sources and trends over time, categorized by 'Lost', 'New', 'Re-new', and 'Won'. It also shows account statistics with similar categorizations. A notification panel indicates 'No records available'. The date range for the data displayed is from January 1, 2019, to June 11, 2019.
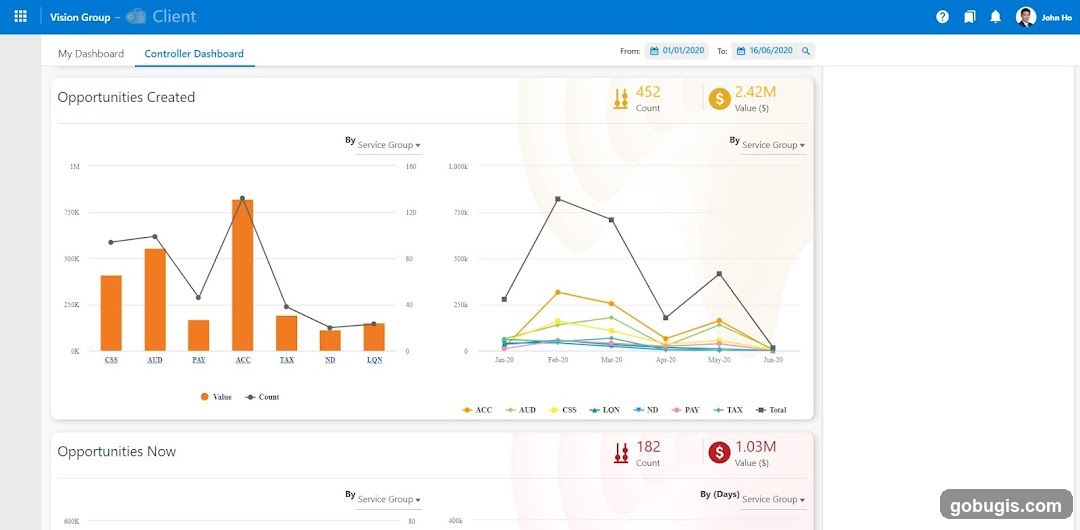
Controller Dashboard
A dashboard displaying 'Opportunities Created' and 'Opportunities Now'. The 'Opportunities Created' section shows two charts: a bar and line chart showing count and value by service group, and a line chart showing trends over time for various service groups. Summary statistics for 'Opportunities Created' show a count of 452 and a value of $2.42M. The 'Opportunities Now' section displays summary statistics of 182 count and $1.03M value, with options to filter by days and service group.
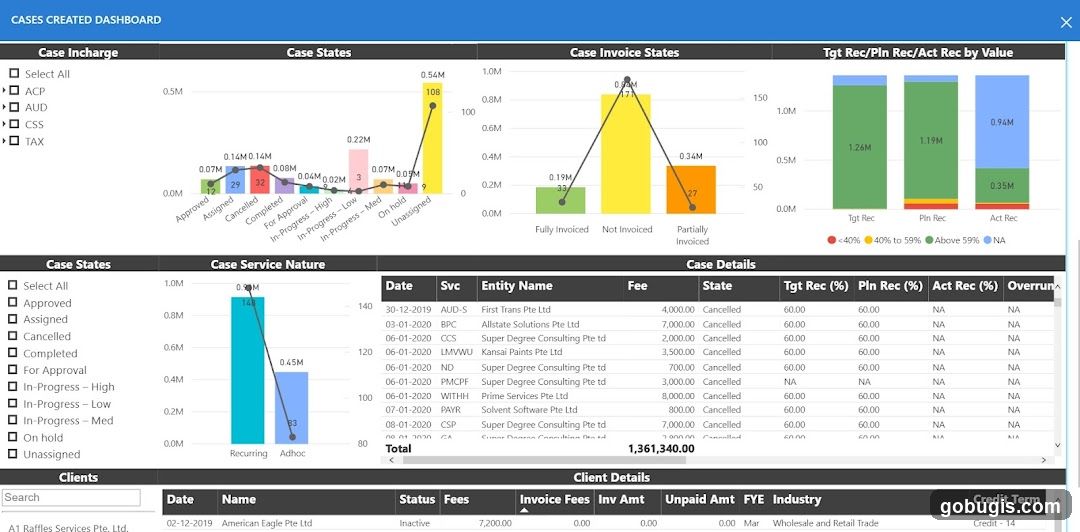
Cases Created Dashboard
A dashboard displaying various charts and tables related to case management. It includes bar and line graphs showing case states, invoice states, and service nature. A table details case information such as date, entity name, fee, state, and recovery percentages. Another section lists client details with information on fees, invoice amounts, and industry.
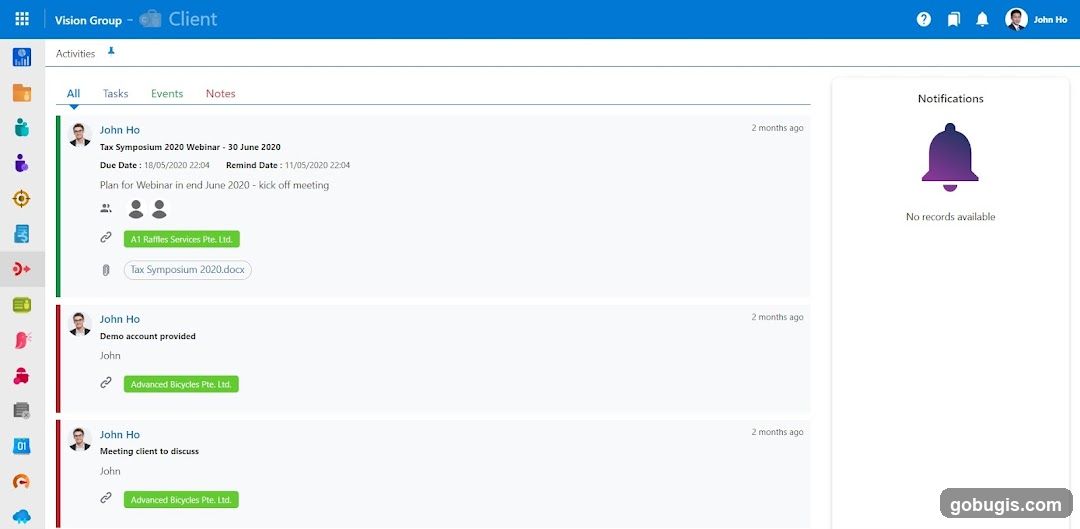
Client Dashboard
A screenshot of a client management dashboard. The dashboard shows a list of activities, including tasks, events, and notes. The current user is John Ho. There are notifications on the right side of the screen, which currently show no records available.
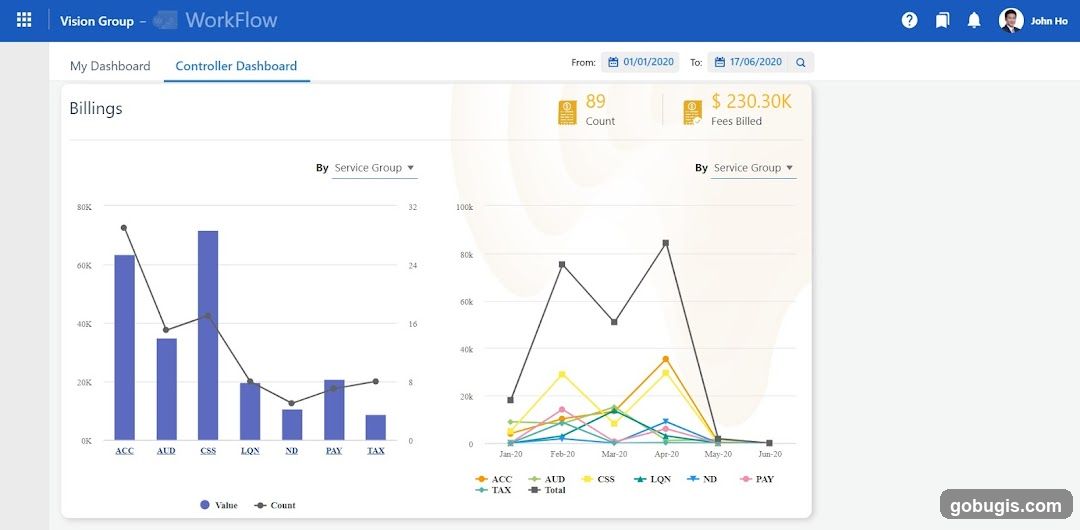
Controller Dashboard - Billings
This is a screenshot of a web application's controller dashboard, displaying billing information. The dashboard shows two charts: a bar and line chart on the left, and a multi-line chart on the right. The left chart breaks down billings by service group, showing both 'Value' (bars) and 'Count' (line). The right chart displays trends over time (Jan-20 to Jun-20) for various service groups including ACC, AUD, CSS, LQN, ND, PAY, TAX, and Total. Key metrics displayed at the top include '89 Count' and '$230.30K Fees Billed'. The date range selected is from 01/01/2020 to 17/06/2020. The user logged in is John Ho.
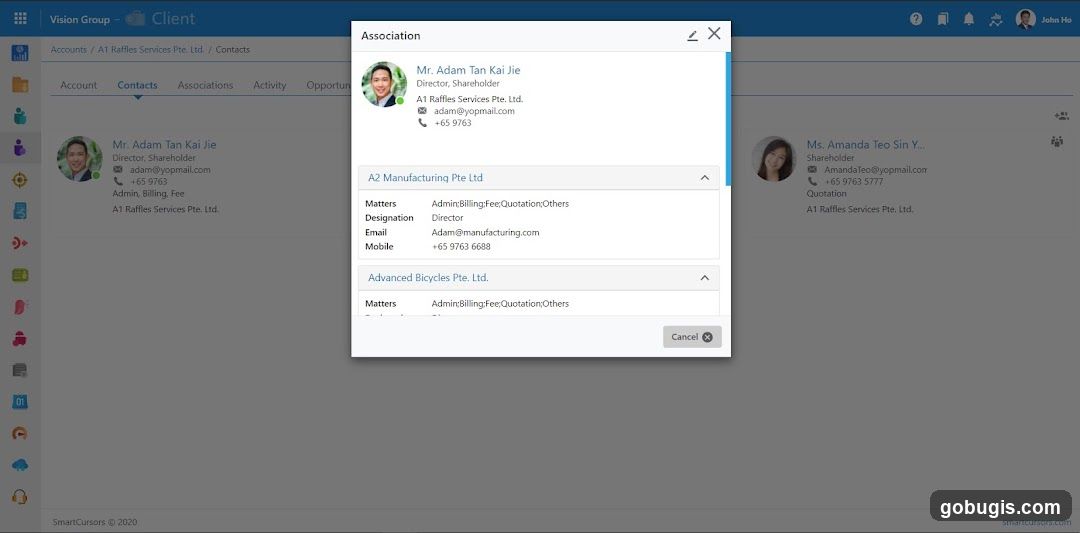
Contact Association Details
This image displays a pop-up window showing contact association details for Mr. Adam Tan Kai Jie. It lists his roles as Director and Shareholder for A1 Raffles Services Pte. Ltd., along with his email and phone number. It also details his associations with A2 Manufacturing Pte Ltd and Advanced Bicycles Pte. Ltd., including matters, designation, email, and mobile number. On the right, it shows Ms. Amanda Teo Sin Y.'s details as Shareholder for A1 Raffles Services Pte. Ltd.
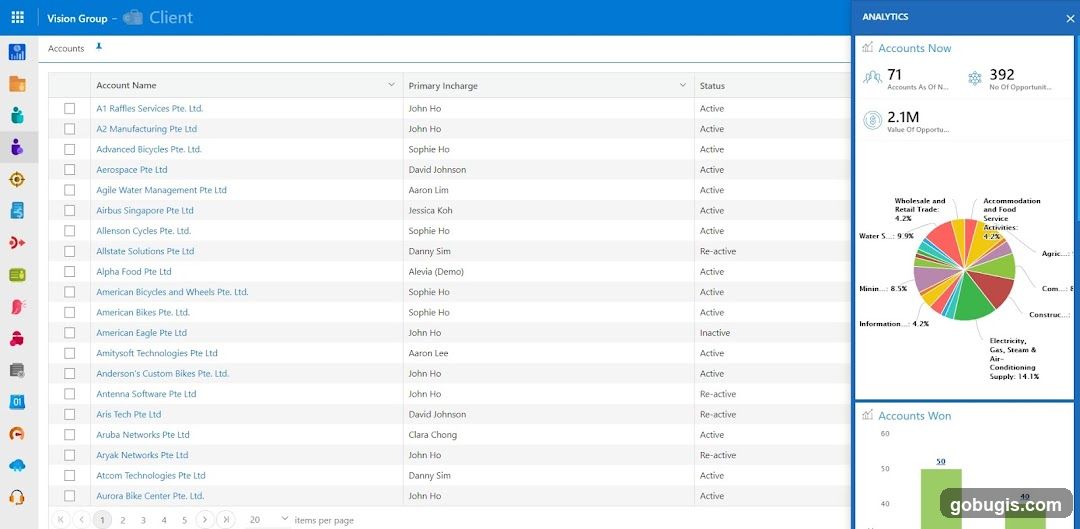
Client Accounts Dashboard
A dashboard displaying client account information and analytics. The main section shows a table of accounts with columns for Account Name, Primary Incharge, and Status. To the right, an 'Accounts Now' section provides summary statistics and a pie chart breaking down account distribution by industry. Below that, an 'Accounts Won' bar chart shows winning account numbers.
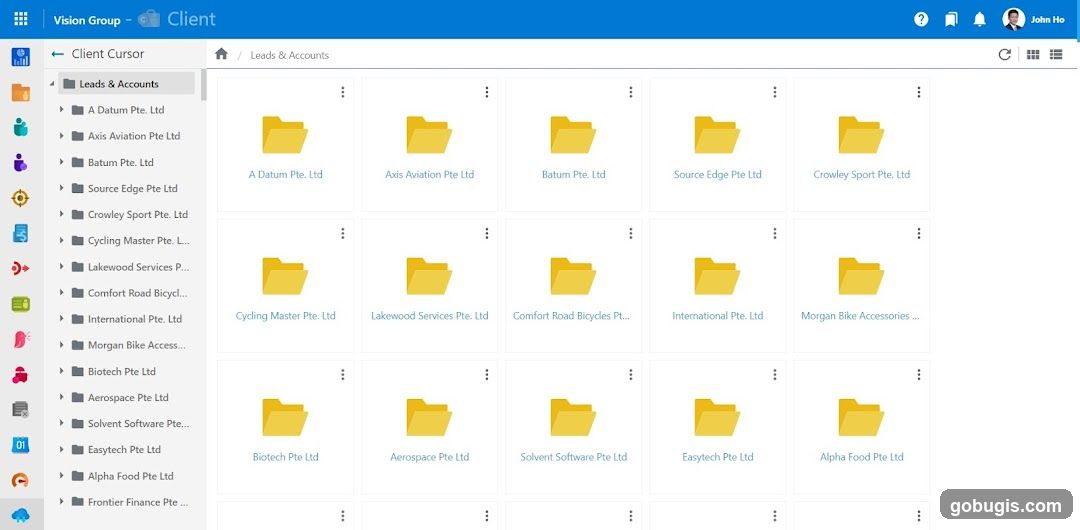
Client Leads & Accounts
A screenshot of a computer interface displaying a list of client leads and accounts organized into folders. The left sidebar shows navigation icons and a list of account names, while the main area displays these accounts as folders with their respective names.
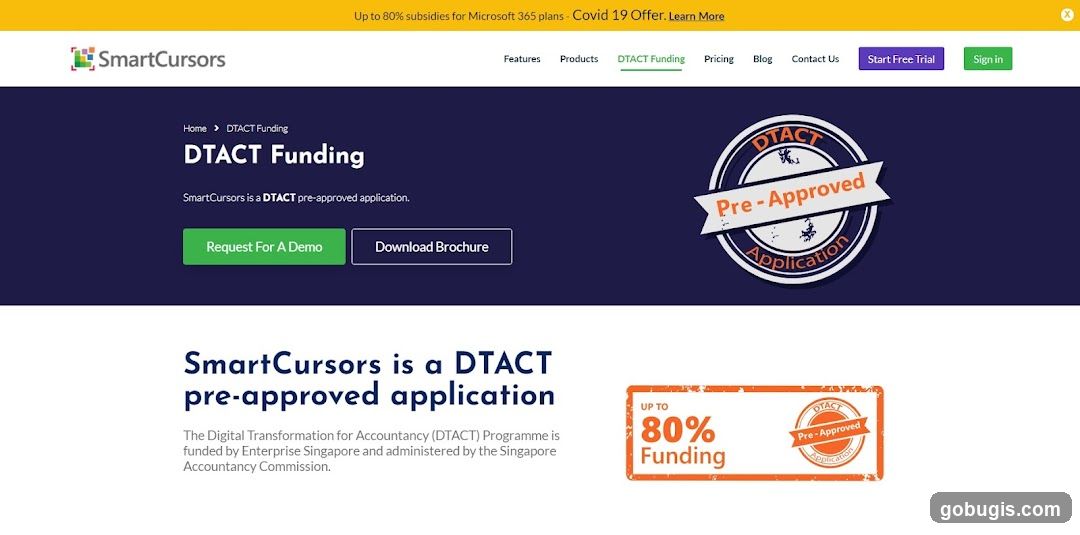
DTACT Funding Page
This is a webpage for DTACT Funding, a pre-approved application by SmartCursors. The page highlights that the Digital Transformation for Accountancy (DTACT) Programme is funded by Enterprise Singapore and administered by the Singapore Accountancy Commission. It offers up to 80% funding. The page includes buttons to 'Request For A Demo' and 'Download Brochure', as well as navigation links for Features, Products, DTACT Funding, Pricing, Blog, and Contact Us. There are also options to 'Start Free Trial' and 'Sign in'. A banner at the top mentions subsidies for Microsoft 365 plans and a Covid-19 offer.
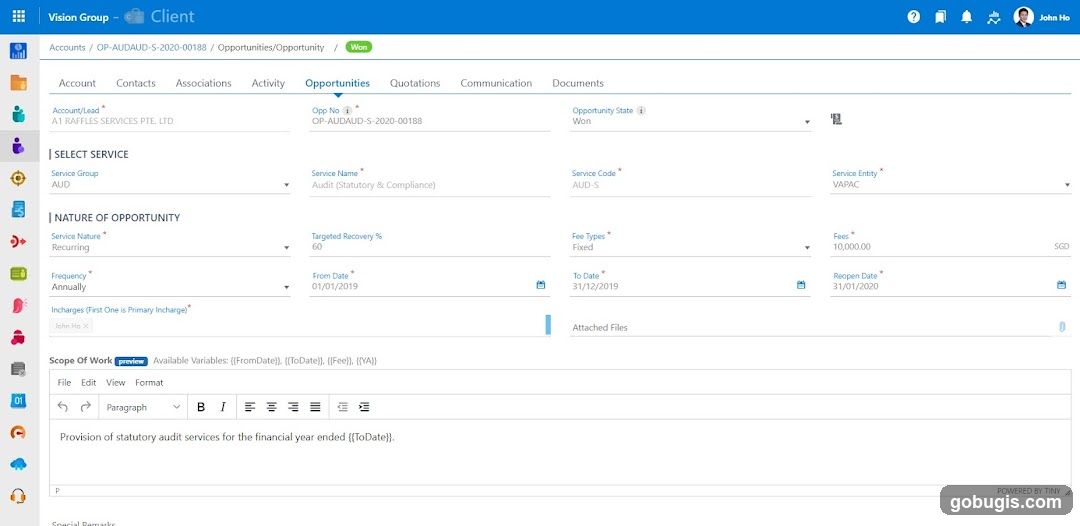
Opportunity Details
This is a screenshot of a client relationship management system, displaying details of a won opportunity. The opportunity is for 'A1 RAFFLES SERVICES PTE. LTD' and involves 'Audit (Statutory & Compliance)' services. Key details include the service group 'AUD', service code 'AUD-S', service entity 'VAPAC', a fee of 10,000.00 SGD, and a duration from 01/01/2019 to 31/12/2019. The scope of work is described as 'Provision of statutory audit services for the financial year ended {{ToDate)}}'. The primary incharge is listed as John Ho.
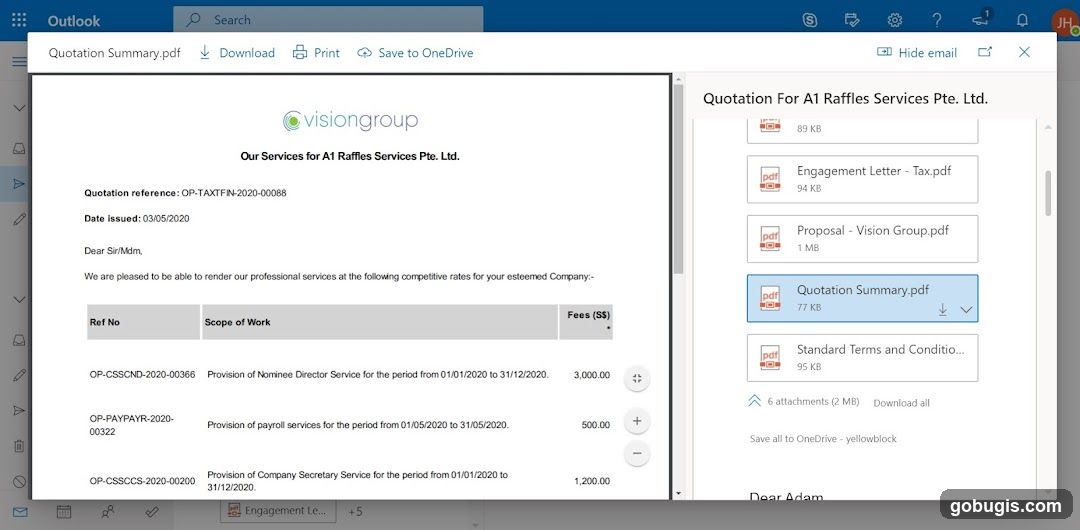
Quotation Summary
A screenshot of a computer screen showing an email client with a quotation document open. The quotation is from Vision Group for A1 Raffles Services Pte. Ltd. It details services such as Nominee Director Service, payroll services, and Company Secretary Service with associated fees. The email client also shows other attached documents like an Engagement Letter and a Proposal.
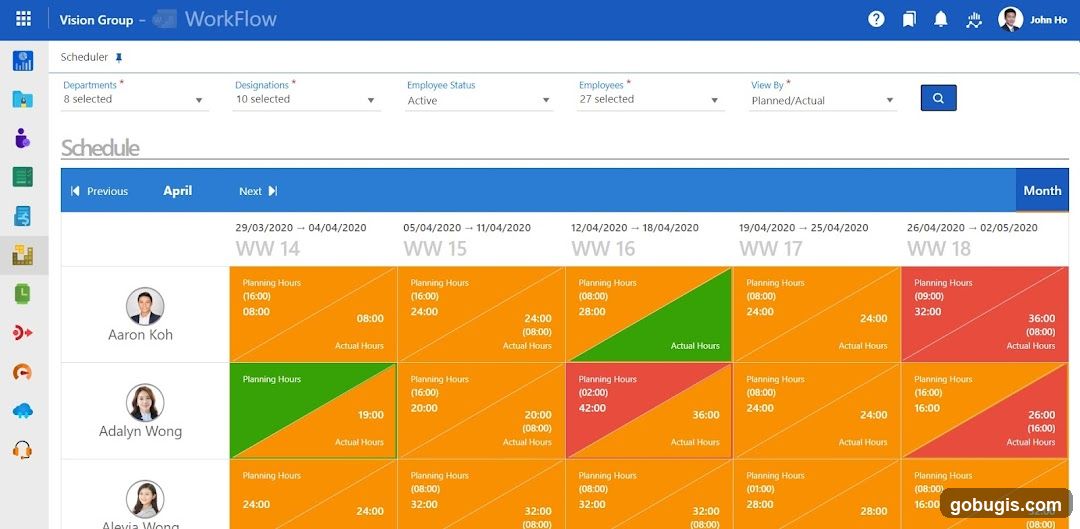
WorkFlow Scheduler
A screenshot of a WorkFlow scheduler interface displaying employee work schedules. The interface shows employee names like Aaron Koh, Adalyn Wong, and Alevia Wong, along with their planned and actual working hours for different weeks in April 2020. Filters for Departments, Designations, Employee Status, Employees, and View By are visible at the top. Navigation controls for Previous, Next, and Month are also present.
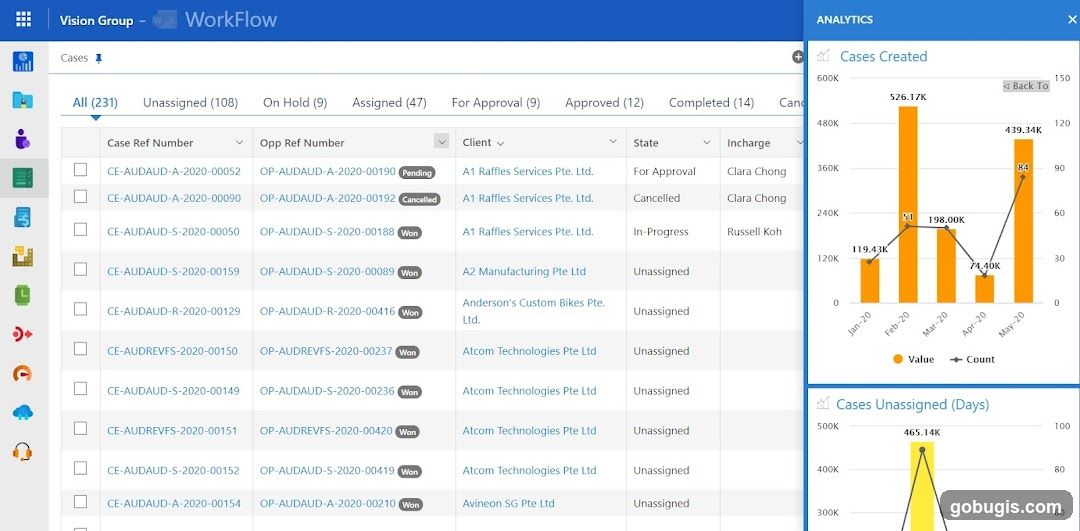
Workflow Analytics Dashboard
A screenshot of a workflow analytics dashboard showing case management data. The dashboard includes a table of cases with details like Case Reference Number, Client, State, and Incharge. It also features two charts: 'Cases Created' showing case volume over time, and 'Cases Unassigned (Days)' displaying unassigned case trends.
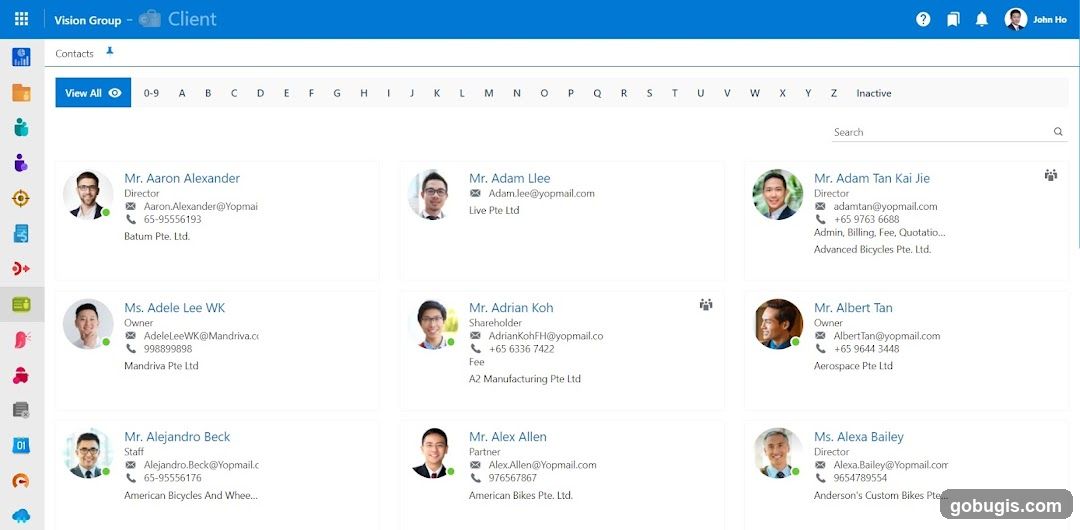
Client Contact List
A digital interface displaying a list of contacts with their names, titles, email addresses, phone numbers, and company affiliations. The interface includes search functionality and alphabetical filtering options.
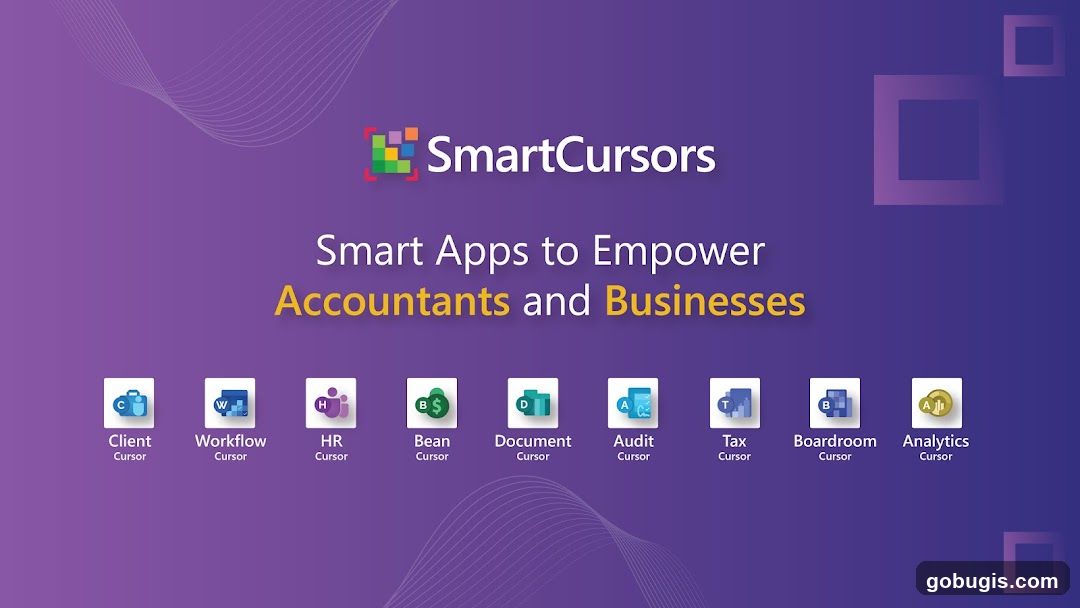
SmartCursors Apps
A graphic displaying the SmartCursors logo and the tagline 'Smart Apps to Empower Accountants and Businesses'. Below the tagline are icons representing various applications: Client Cursor, Workflow Cursor, HR Cursor, Bean Cursor, Document Cursor, Audit Cursor, Tax Cursor, Boardroom Cursor, and Analytics Cursor.
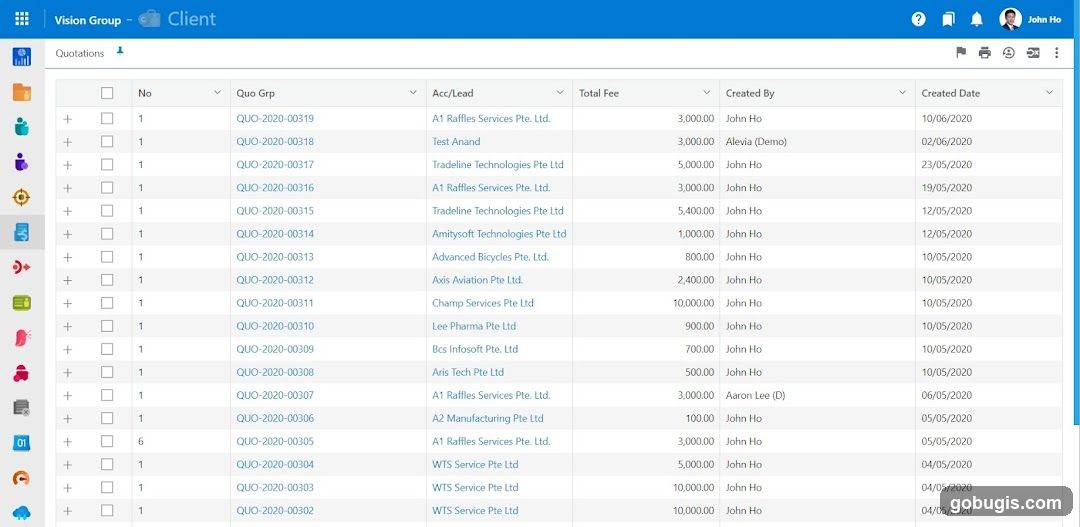
Quotations List
A screenshot of a software interface displaying a list of quotations. The table includes columns for No, Quo Grp, Acc/Lead, Total Fee, Created By, and Created Date. Each row represents a quotation with details such as the quotation group number, the client or lead name, the total fee, the user who created it, and the creation date.
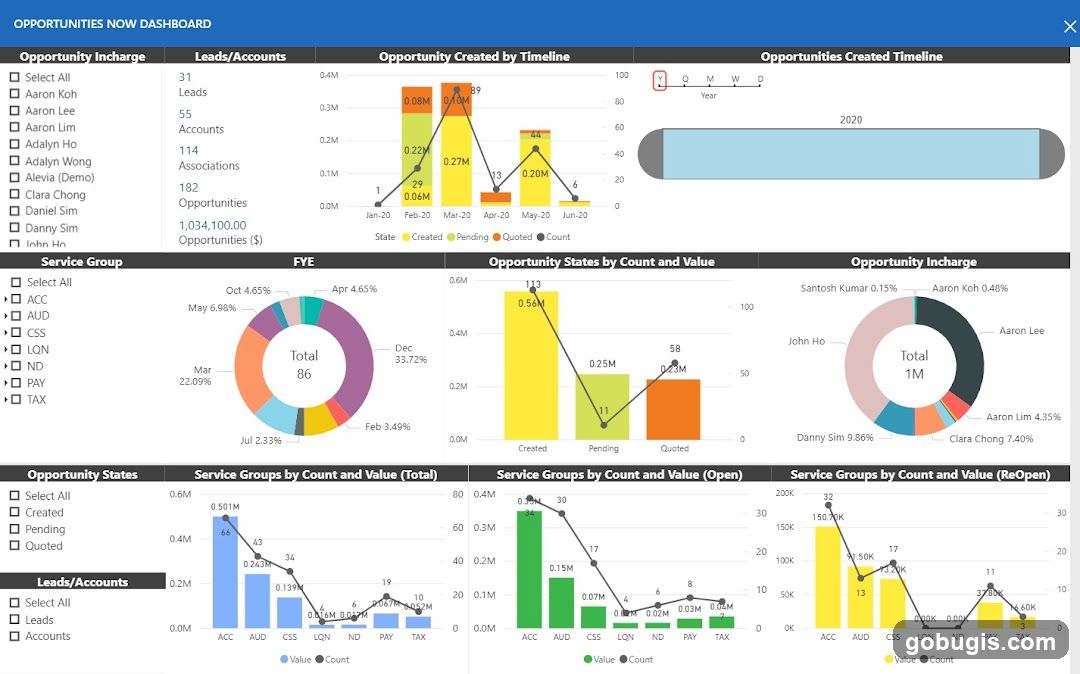
Opportunities Now Dashboard
A dashboard displaying various charts and tables related to sales opportunities. It includes sections for Opportunity Incharge, Leads/Accounts, Opportunity Created by Timeline, Opportunities Created Timeline, Service Group FYE, Opportunity States by Count and Value, Opportunity Incharge pie chart, Opportunity States, Service Groups by Count and Value (Total), Service Groups by Count and Value (Open), and Service Groups by Count and Value (ReOpen).
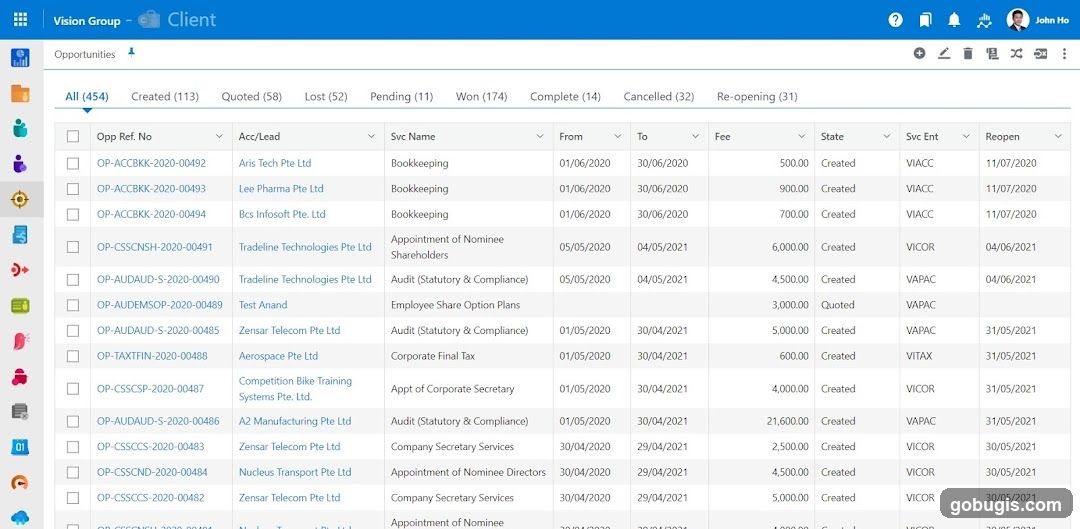
Opportunities Dashboard
A screenshot of a business software dashboard displaying a list of opportunities. The dashboard includes columns for Opportunity Reference Number, Account/Lead, Service Name, From Date, To Date, Fee, State, Service Entity, and Reopen Date. Various tabs are visible at the top, including 'All', 'Created', 'Quoted', 'Lost', 'Pending', 'Won', 'Complete', 'Cancelled', and 'Re-opening'. A user profile icon with the name 'John Ho' is in the top right corner.
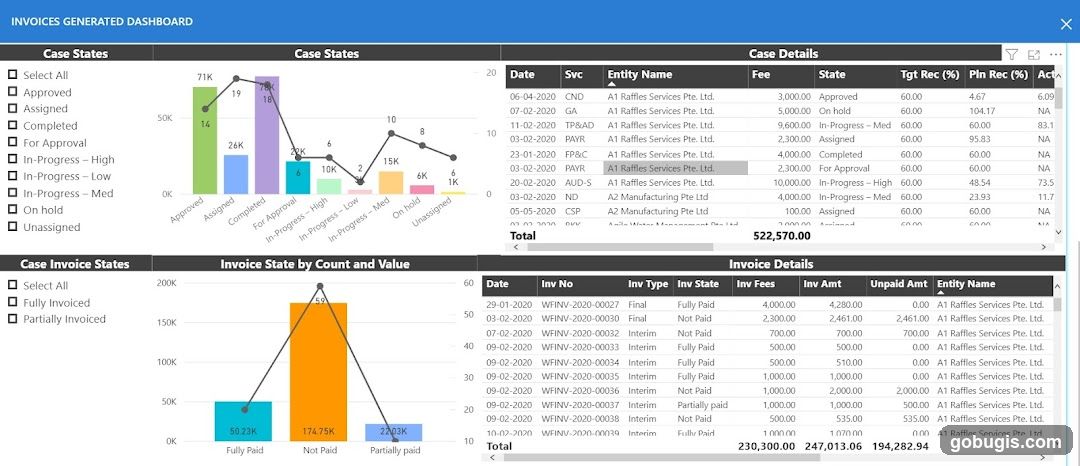
Invoices Generated Dashboard
A dashboard displaying invoice and case details with various charts and tables. The top section shows 'Case States' with a bar and line chart illustrating counts for different states like Approved, Assigned, Completed, etc. A table lists 'Case Details' with columns for Date, Svc, Entity Name, Fee, State, and more. The bottom section presents 'Case Invoice States' with a bar chart showing counts for Fully Paid, Not Paid, and Partially Paid invoices. Another table details 'Invoice Details' including Invoice Number, Type, State, Fees, Amount, and Entity Name.
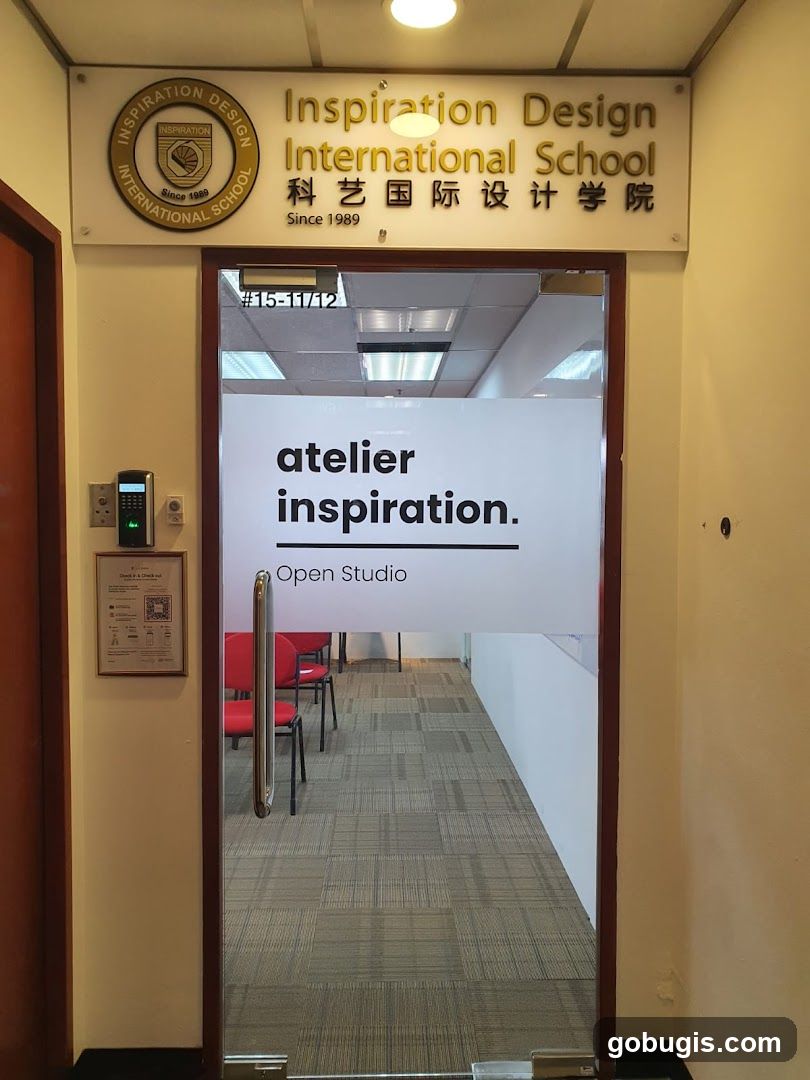
Interior design school at OG Complex offering diploma and advanced diploma progr
View Shop
Streetwear fashion boutique at Bugis Street with graphic tees and urban casual w
View Shop
Lighting retailer and wholesaler at Sim Lim Tower with residential and commercia
View Shop